Carbon and Energy Management

Carbon and Energy Management

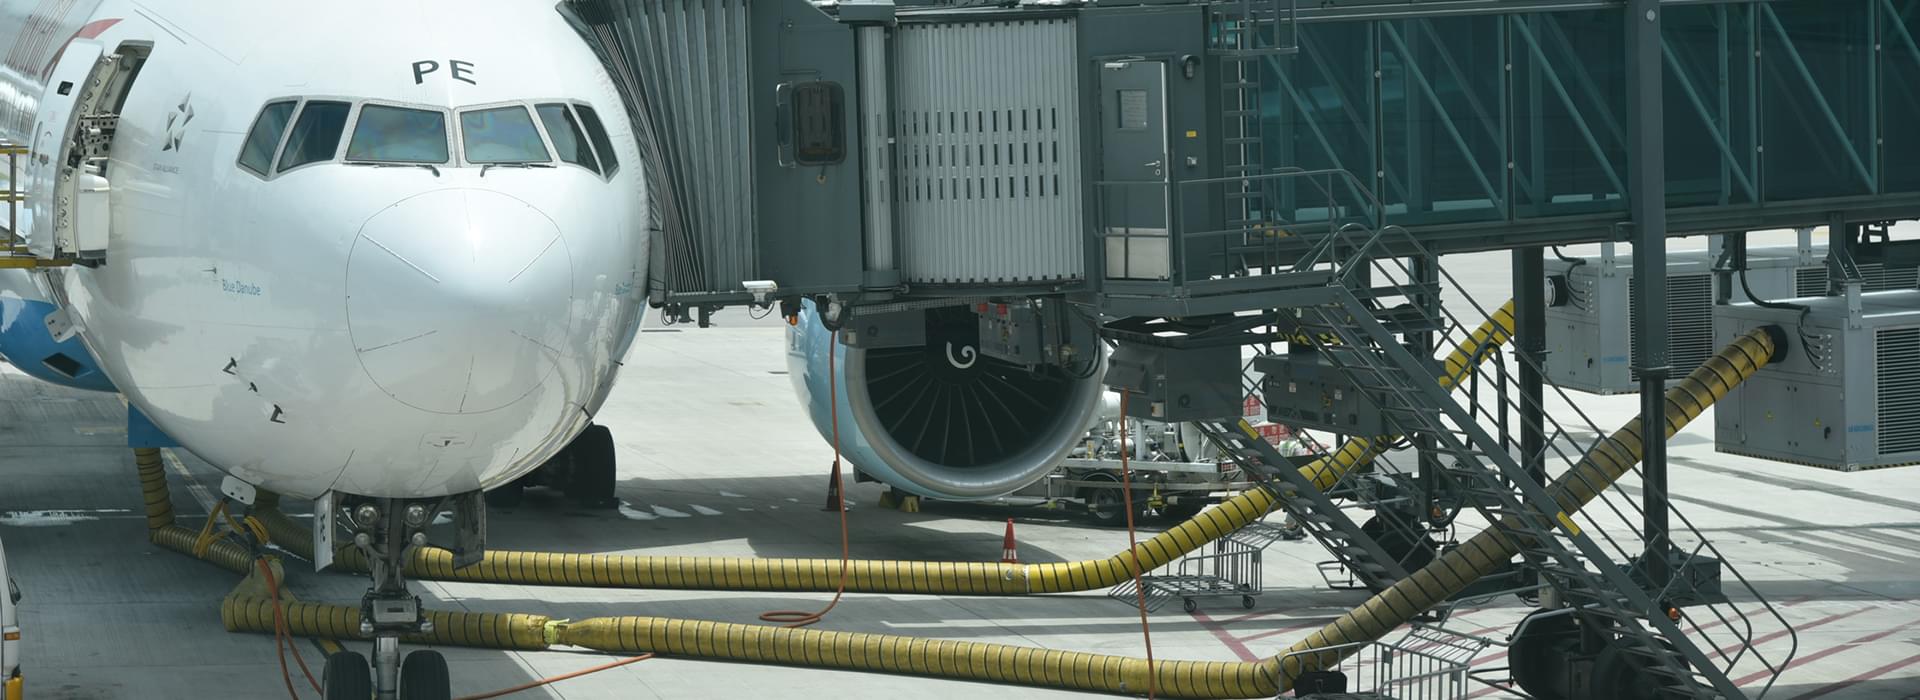
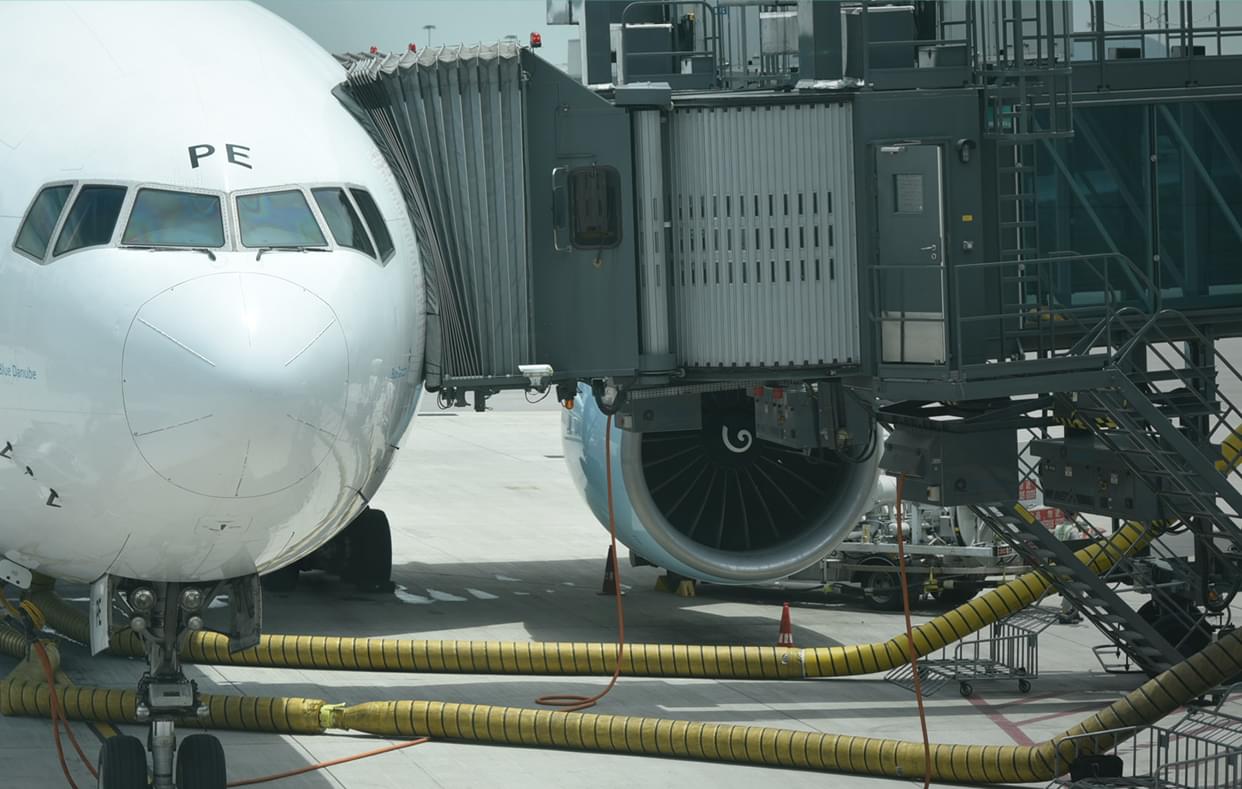
While global and regional demand for air travel continues to grow, we have to work closely with the airport community to decouple our business growth from an increase in greenhouse gas emissions.

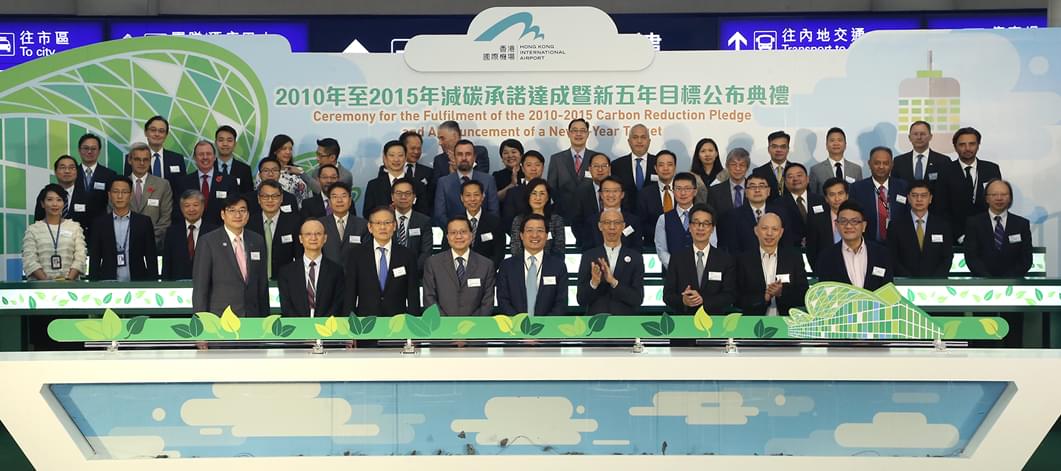
By the end of 2015, AAHK and over 40 business partners had achieved a 25.6% reduction in airport-wide carbon intensity1 compared to the 2008 baseline, surpassing the original target of reducing carbon intensity by 25% set in 2010. Please refer to page 76 of our Sustainability Report 2015/16 for HKIA’s airport-wide carbon performance between 2008 and 2015. In November 2016, together with 53 business partners, AAHK announced a new airport-wide target of reducing a further 10% carbon intensity by 2020 compared to 2015 levels.

1Carbon intensity refers to carbon emissions per workload unit. One workload unit is equal to 1 passenger or 100 kg of cargo.

New five-year carbon reduction target and support strategies

In 2015/16, we commissioned a consultancy study to establish a new carbon reduction target. This involved extensive engagement, both internally and with our business partners, to identify potential reduction opportunities, and to develop the target to reduce airport-wide carbon intensity by 10% by 2020 compared to 2015 levels.

To support our business partners in meeting the new target, we have developed four support strategies.

  1. The Senior Executive Roundtable brings together senior executives of business partners for a high-level discussion on the business case for carbon reduction.
  2. The Technical Working Group offers bi-annual technical training to business partners on carbon and energy saving solutions. The first meeting was held in April 2017 in which representatives from AAHK and airport business partners shared their experience on the implementation and operation of the ISO 50001 Energy Management System.
  3. The sector-based Benchmarking Scheme provides sector-specific emissions data, enabling business partners to compare their performance against the average in their industry.
  4. The Carbon Reduction Award scheme recognises business partners’ efforts in reducing carbon emissions and promotes best practices.

In 2016, a 0.5% reduction was achieved, which exceeds the performance projected in the carbon reduction target consultancy study.

HKIA’s airport-wide carbon emissions and intensity

Carbon emissions in 2015*: 427,187 tonnes of CO2e
Carbin intensity in 2015*: 3.80 kg CO2e per workload unit

Carbon emissions in 2016: 438,243 tonnes of CO2e
Carbin intensity in 2016: 3.79 kg CO2e per workload unit

2015*
Carbon emissions (tonnes of CO2e)
427187
Carbon intensity (kg CO2e per workload unit)
3.80
2016
Carbon emissions (tonnes of CO2e)
438243
Carbon intensity (kg CO2e per workload unit)
3.79

* The figure for 2015 includes emissions from the larger number of business partners which committed to the new 10% carbon reduction target made in 2016. Therefore, they are not the same as the 2015 figure disclosed in our Sustainability Report 2015/16.

AAHK accounts for approximately 40% of HKIA’s airport-wide carbon emissions. Electricity consumption is the major contributor, accounting for over 90% of AAHK’s carbon emissions. In 2016/17, we recorded a year-on-year increase of about 10% in both absolute electricity consumption and electricity intensity, which was principally due to the first full year of operation of the Midfield Concourse (MFC).

Key initiatives

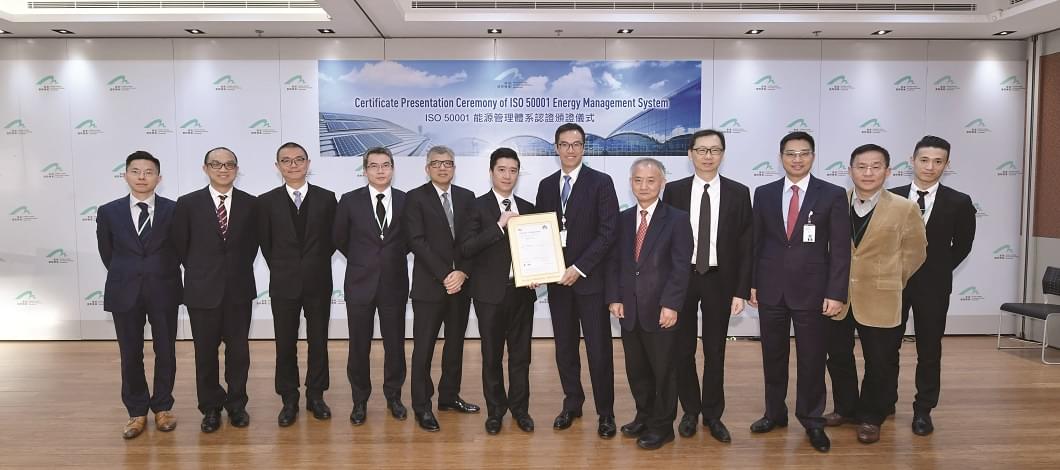
In February 2017, we achieved the ISO 50001 Energy Management System (EnMS) Certification for Terminal 1 (T1). We will expand the scope of EnMS to the North Satellite Concourse (NSC) and the MFC by 2018.

We continue to seek further improvements in energy performance. Example projects include pilot installation of a building analytic system in the NSC and commissioning of the locally-developed Smart-to-Charge electric vehicle (EV) charging facility, which was developed in partnership with The Hong Kong Polytechnic University.

Energy saving projects and expected energy saving

  • Completed replacing two energy efficient high-voltage chillers in 2016/17 Q2; 9.8 million kWh/year
  • Completed replacement of LED gantry lights in Terminal 2 in 2016/17 Q2; 0.56 million kWh/year
  • Started replacing LED lights in T1 in 2016/17 Q3; 3.54 million kWh/year (by 2020)
  • Completed the retro-commisioning of mechanical ventilation and air-conditionaing system in T1 in 2016/17 Q4; 1.9 million kWh/year
  • Completed the fine tuning of lighting operation for different seasons and weather in 2016/17 Q4; 0.17 million kWh/year
  • Complete the modification of gantry lighting control in T1 in 2017/18 Q4; 0.85 million kWh/year
  • Complete the installation of apron high mast LEDs in 2019/20 Q2; 1.4 million kWh/year
2016/17 Q2
Completed replacing two energy
efficient high-voltage chillers
9.8
million kWh / year
Completed the replacement of LED gantry
lights in Terminal 2
0.56
million kWh / year
2016/17 Q3
Started replacing LED lights in T1
3.54
million kWh / year (by 2020)
2016/17 Q4
Completed the retro-commissioning of
mechanical ventilation and
air-conditioning system in T1
1.9
million kWh / year
Completed the fine tuning of lighting operation for different seasons and weather
0.17
million kWh / year
2017/18 Q4
Complete the modification of gantry lighting
control in T1
0.85
million kWh / year
2019/20 Q2
Complete the installation of apron high
mast LEDs
1.4
million kWh / year